Technical Curriculum Task Force
Role
User Researcher
Statistics
350+ Survey Participants , ~100 Focus group participants
TL;DR
I helped conduct a college wide research project to identify student needs and pain points with the programming curriculum. We corroborated evidence from educators and provided context to school officials to make changes to coursework offerings.
Timeline
4 Months | Feb 2019 - May 2019
Employer
The University of Michigan - School of Information
Methods
Surveys
Focus Groups
Objective
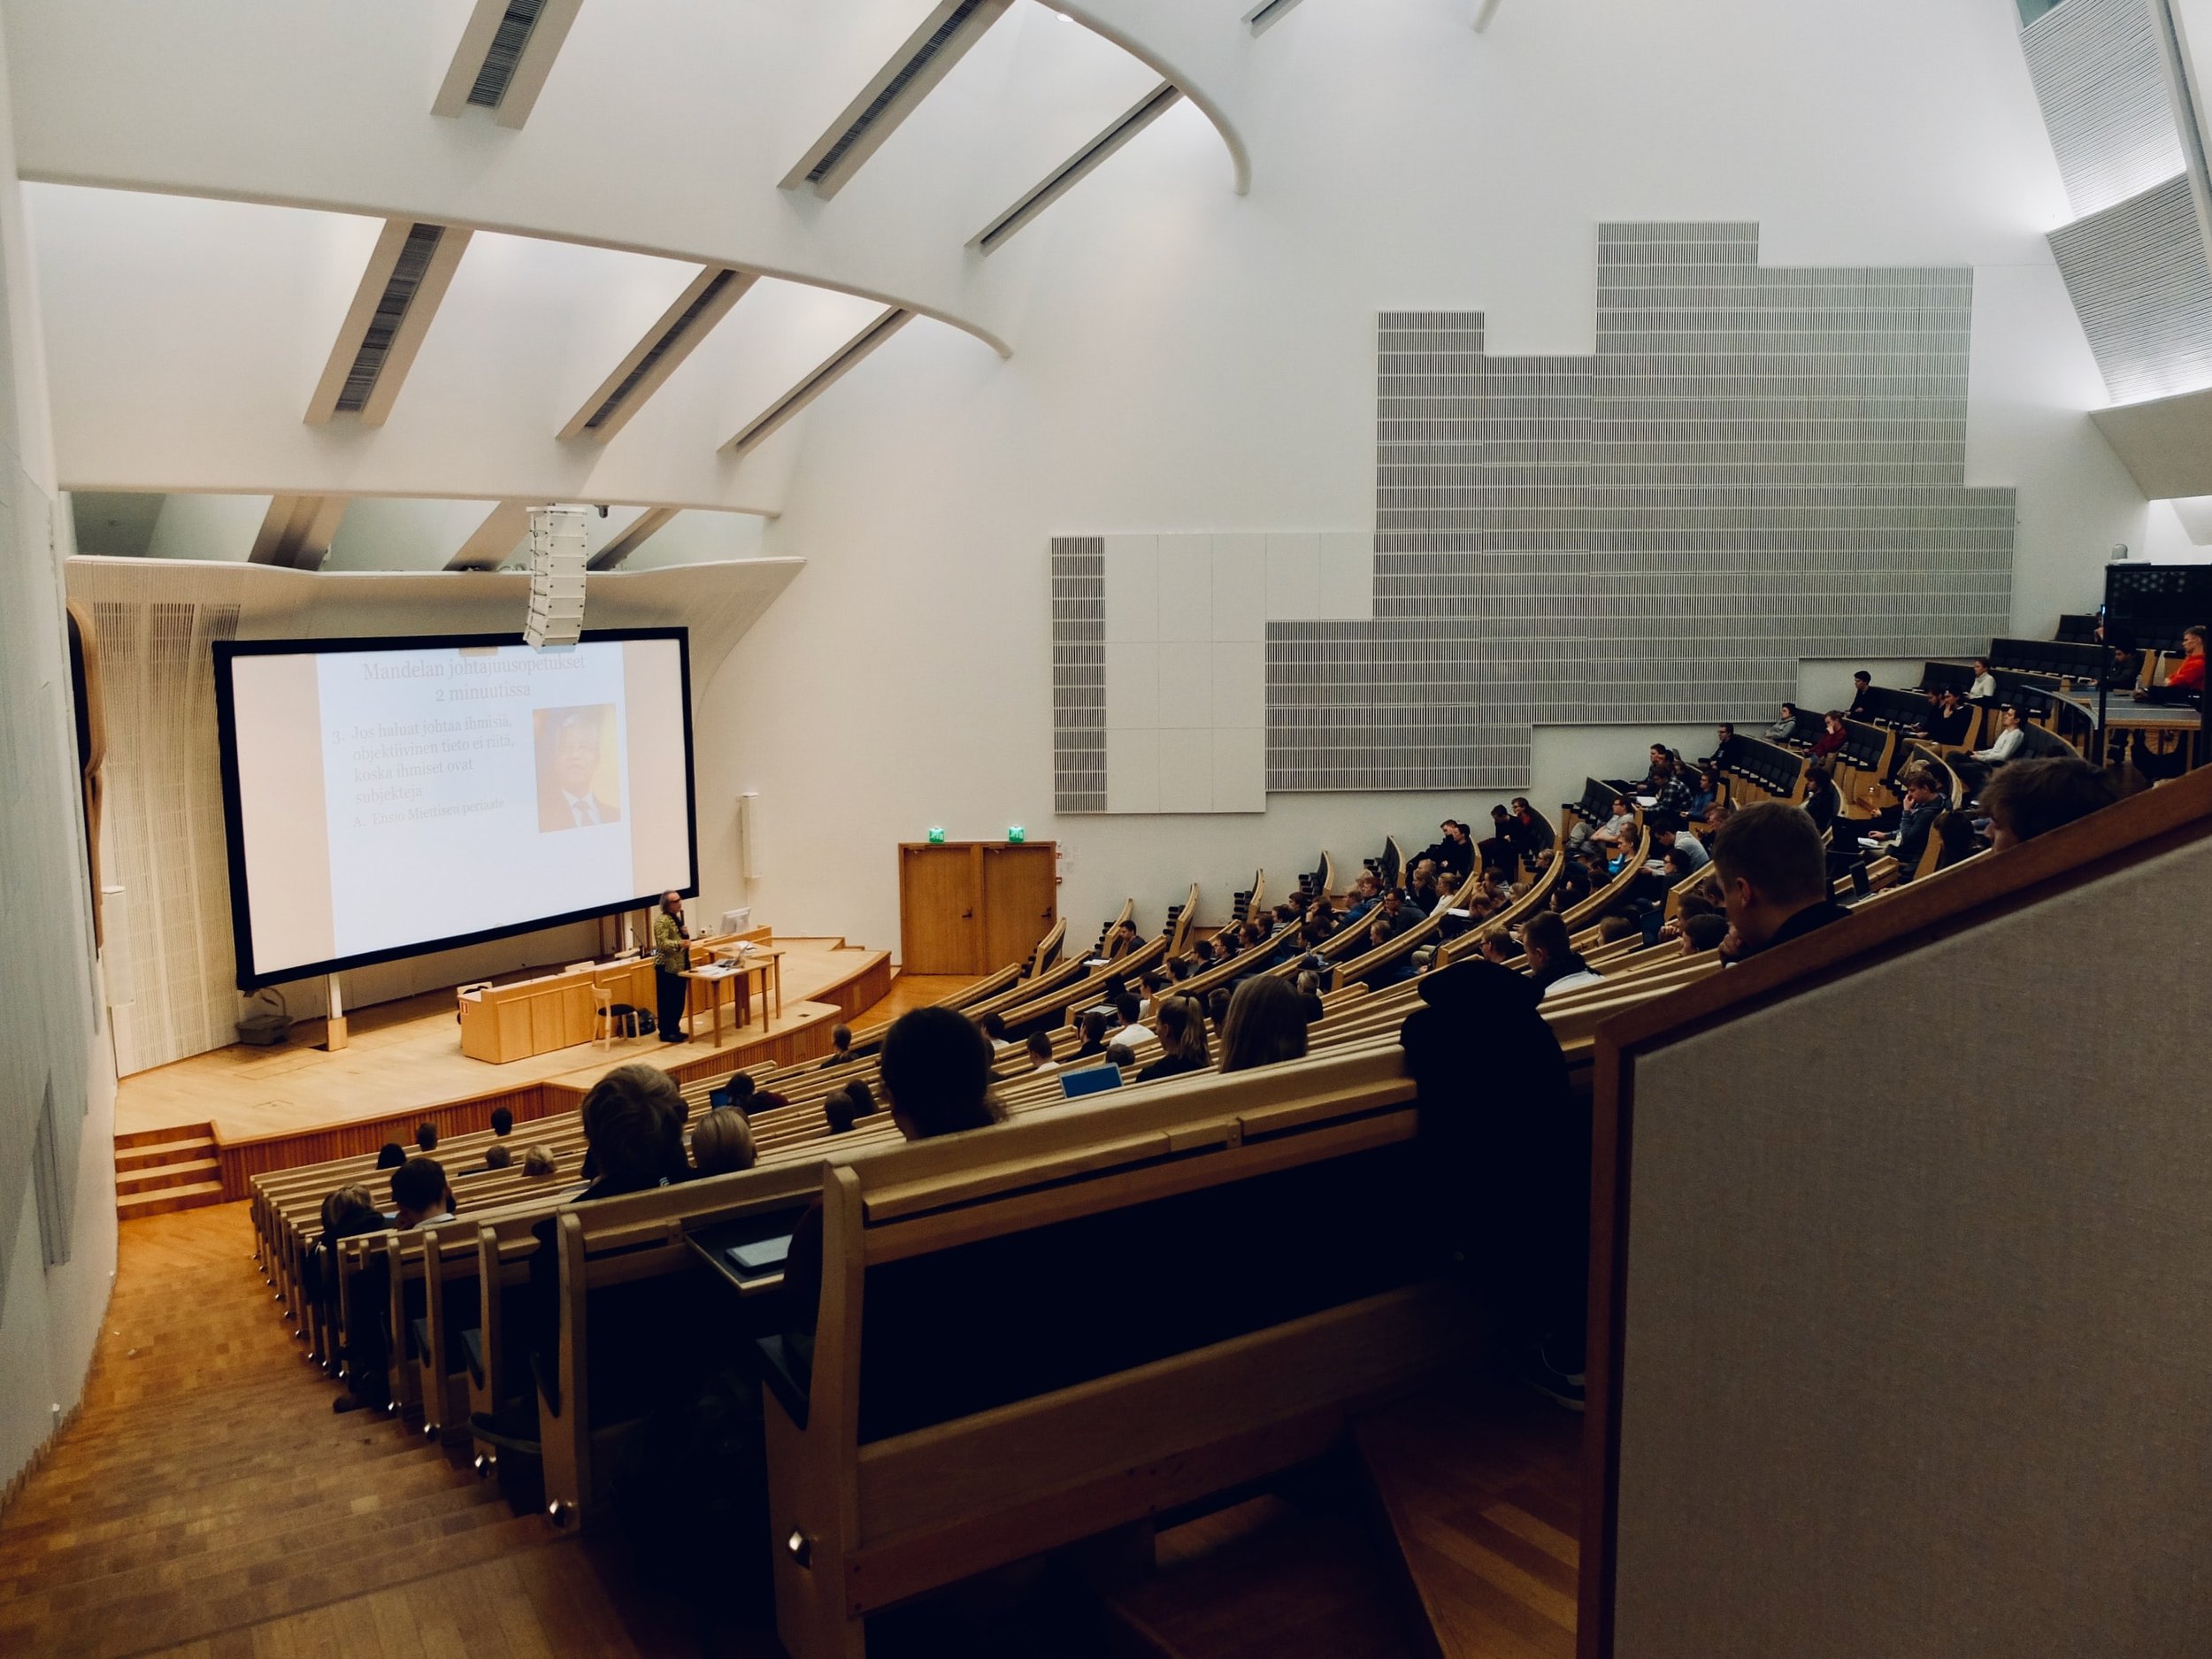
The University of Michigan School of information (UMSI) serves students with a variety of unique career goals, and accepts students with varied backgrounds and skills. Basic introductory programming skills is a mandatory part of the curriculum, however anecdotally the faculty had continually heard complaints from students that the coursework is both too hard and too easy. Professor Mark Newmann who headed the project hypothesized that the programming coursework offered at the school of information was taking a one size fits none approach. Professor Newmann tasked me and another researcher with assessing the student population and understand what was and wasn’t working with current students regarding the programming curriculum offering at SI (The School of Information).

Process
Problem Definition
Research Plan
Recruitment
Research
Analysis
Report
Problem Definition

Background
Beginning in 2016, the SI technical curriculum had gone through a number of revisions to better adapt to the interests of incoming students with courses being dropped and new courses added. As part of an assessment of that prior revision, some faculty and students were presenting concerns to Professor Mark Newmann. In higher level courses faculty expressed that there was too much skill disparity among students, forcing faculty to give remedial education and slowing the progress of all students. Students expressed equal concerns that coursework does not build upon one another, skills they learn in one is not sufficient to start learning in another and because of the school requirements that all student must take programming the skills gap starts at the beginning.
Presenting problem
At large, it appeared students and faculty were unsatisfied with the technical curriculum. These concerns were only being heard by select vocal groups however, prompting an assessment of school wide attitudes and experiences with the programming coursework offered at SI. If it was true that the coursework was problematic who was it problematic for, what were the ramifications, and what might be done about it?
Research Plan

Under the direction of Professor Mark Newmann, he broke up the research endeavors into 2 distinct efforts.
Gathering faculty input
Gathering student input
My task was to assess student input and share the results so that findings from both faculty and students could be condensed into a shareable report recommending next steps to the school director.
Objectives - Survey
Recognizing the anecdotal nature of the current evidence the first thing we needed was a representative sample of the student population to validate current assumptions. The best means of doing this was through a survey.
Identify student satisfaction - understand sentiment both at the macro (overall curriculum) and micro level (individual classes)
Identify student affinity towards programming - Did dissatisfaction come simply from a lack of interest in the subject?
Evaluate skills levels prior to classwork - do students need prior skills to be successful? How wide is the disparity between students based on skill level?
Segment the student population into persona groups - as a whole, how do certain groups of students feel and what distinguishes them from one another?
Objectives - Focus groups
As a follow up to the survey we wanted to meet with respondents in focus groups to give clarity to responses in the survey
Understand why students felt the way the did about the programming coursework - Get clarity to the problems they face knowing their interests, skills, and sentiments
Assess the prevalence of each persona groups feedback - how much attitudinal variance exists within groups?
Give context to survey responses - If students were dissatisfied with particular subjects, why were they dissatisfied and what contributed to it?
Recruitment
Strategy
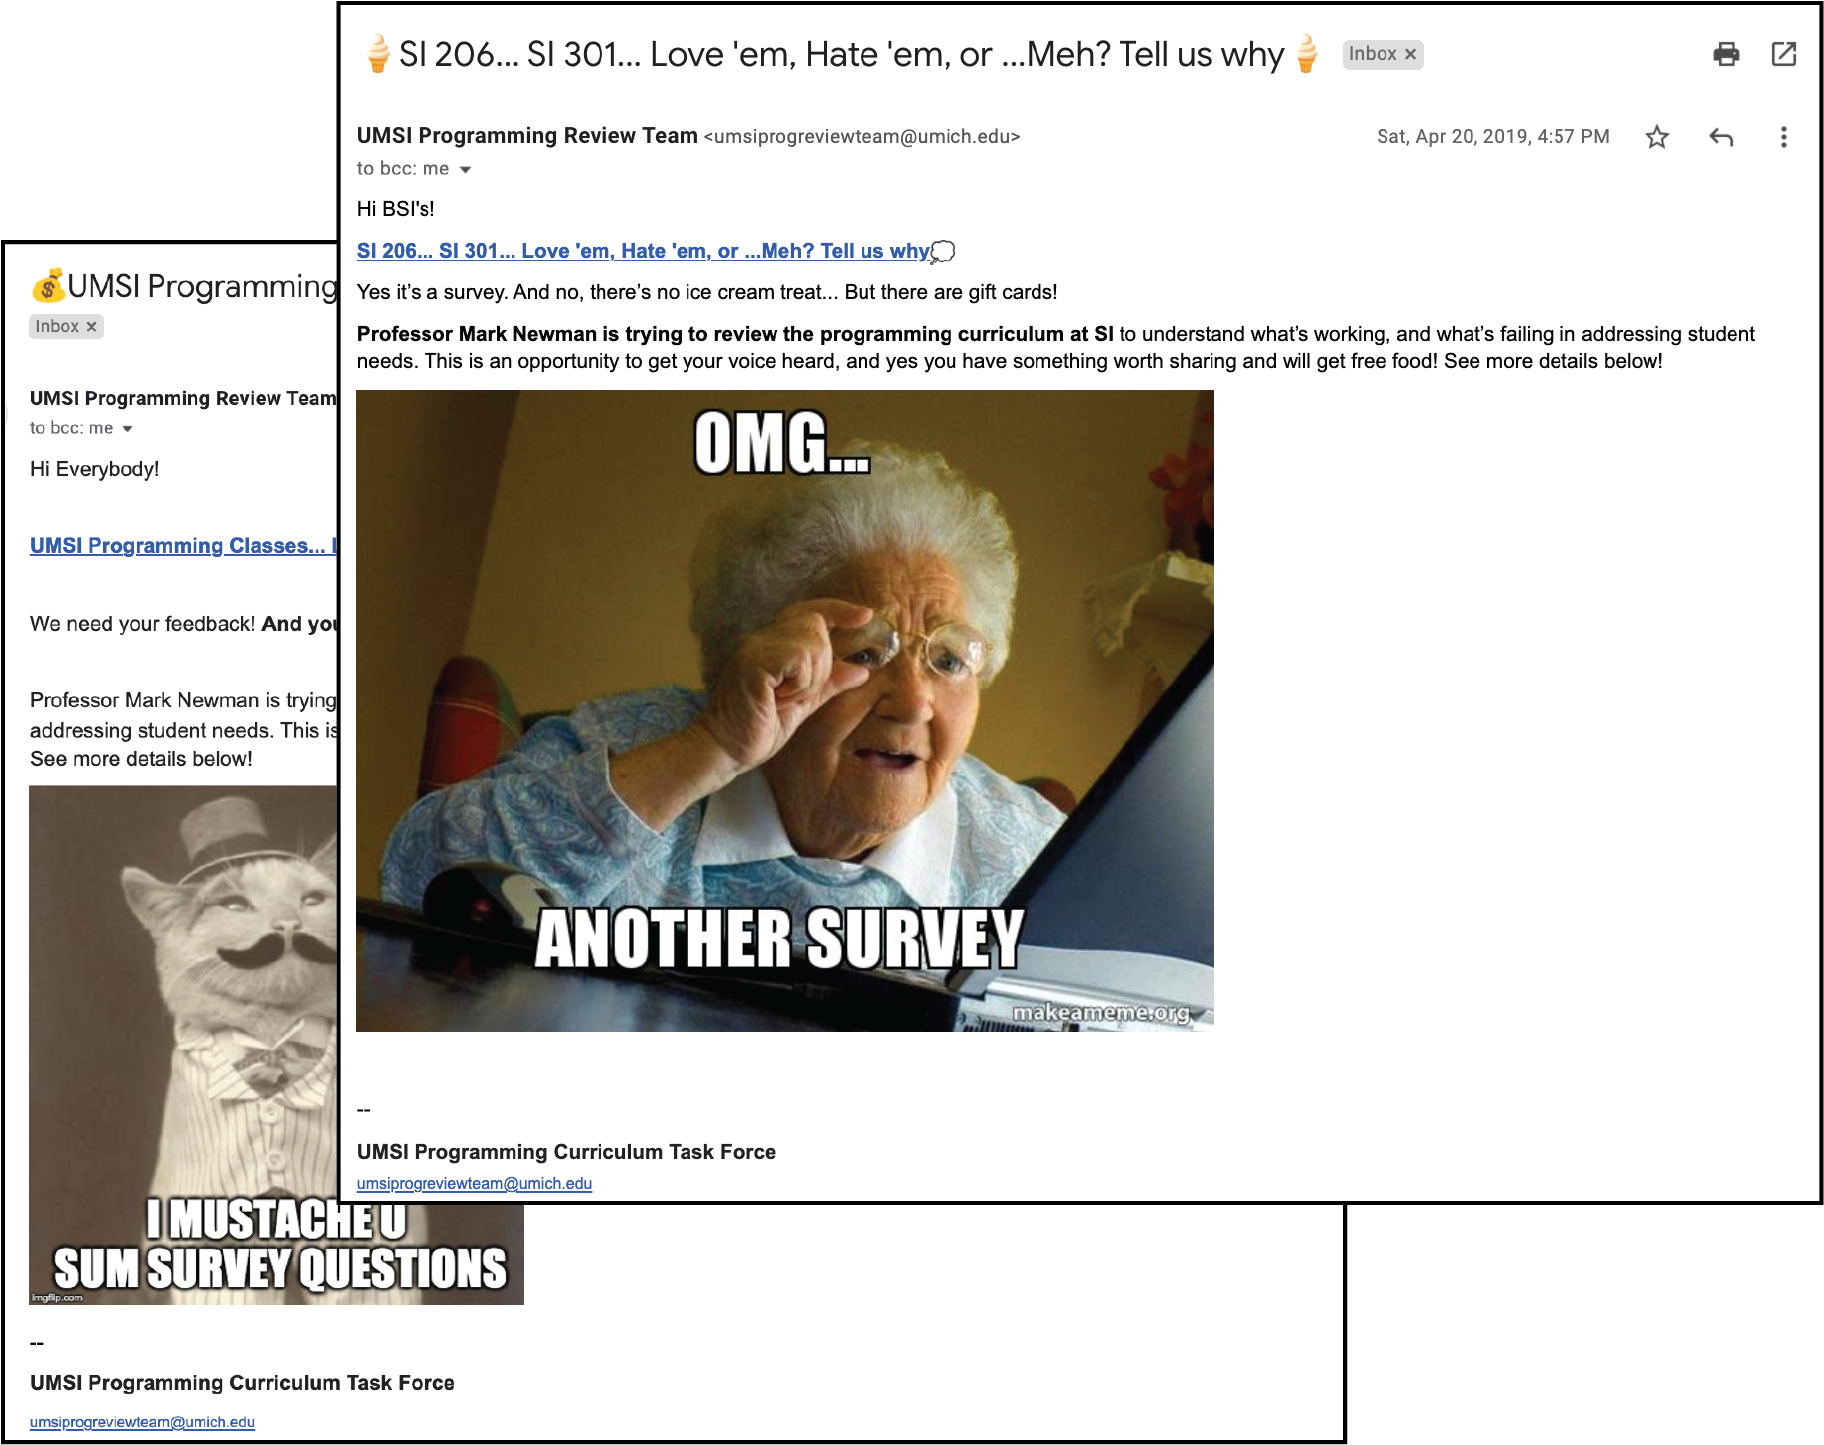
The School of Information had existing modes of communication to connect with students across multiple levels at the college, all students could be contacted through the existing email listserv. The challenge was that this was a very busy form of communication as students would receive multiple emails from multiple organizations on a daily basis. So while we knew we could get everyone, it was way overused. Our strategy to improve our odds of visibility and engagement was to use humor to bring students in, incentivize with gift cards to increase participation, and ensure optimal timing of our initial emails.
Our initial email was the main recruiting tool to get participants to take the survey, we then used the survey itself as a recruiting tool for focus groups. Again a similar strategy was employed, emphasizing the student unique contributions to our research and incentivizing with time appropriate food (breakfast donuts/coffee, lunch pizza, etc.).

Participant Summary

Response rates were very high, out of an approximately 1000 student population we had around 350 survey responses meaning we captured feedback from approximately 35% of students. Approximately 100 students signed up for focus groups, so we were successful in getting a fairly representative sample of the student population for our research.
There was a good mix of Masters & Bachelors level students (~100 BSI students, 200+ MSI students) and even though there was a heavier participation rate among Masters level students that was expected as the school enrolls more masters level students anyway.
Research
Survey
We launched our survey using Qualtrics, from our initial responses were were able to identify 12 main personas that were split up based upon degree type, goals, programming background & experience, interest level, and general needs for programming coursework. We were also able to identify general prevalence rates which helped us understand which experiences were most common. The survey was open for 2 weeks, with the majority of responses coming within the first 5 days. For participants who agreed to participate in focus groups we matched individuals based on their persona profiles.


Focus Groups
Once we were able to recruit a sufficient number of students we paired them into groups to conduct focus groups. Due to scheduling conflicts and lower participation rates of some we had to modify a few focus groups to include multiple personas, but we were able to adequately cover 9 of the 12 personas to gather their input. Where participant numbers were higher in some groups they were split up to have multiple sessions. In all 14 sessions were held to understand the student experience from 12 persona groups.
Analysis
Survey analysis

To assess the survey we used basic descriptive statistics (mean, median, mode, standard deviation, etc) to segment our population. The main purpose of the survey was to identify general sentiment towards programming coursework, evaluate why that sentiment existed, and segment our population into representative groups. In general, student career goals drove segmentation and we identified from describing responses slightly positive sentiment towards coursework although we did identify that beginning coursework and later more advanced coursework had a discrepancy in their difficulty level suggesting that foundational coursework did not prepare students sufficiently for later classes.

Focus group analysis
At the end of the each focus group session my co-researcher and I would debrief to identify common themes from the interviews and document those findings in our notes. One of the key challenges to this project was working on an expiring contract, my co-researcher and I were about to graduate, which meant once we lost our status as students we could no longer qualify to work on the project. By the time that our interviews were conducted we only had 1 week to finalize our work. In order to meet deadlines we used this debriefing format to quickly summarize findings from the interviews and amalgamate feedback. Because we wouldn’t have the time to conduct a formalized affinity diagram we focused on reviewing and capturing insights as close to the interviews as possible to improve the fidelity of research findings.


Report

Because my work contract had expired after the school year had ended I was unable to participate in the creation of any reporting documents. Professor Newmann was the author of the report itself but utilized us as reviewers to gather input and offer expertise where needed. Some of the key recommendations came as a result of the feedback from focus groups, namely that new courses should be developed to address students with different career goals.
Challenges & TakeAways
Working on a project with 12 personas was a challenge because of the various needs of each group, especially when attempting to ensure their unique voices were all captured. If I could have done things differently I would have focused on creating synthesized themes in an online whiteboard, even though we lacked time to sufficiently conduct synthesis, using a tool like that would have made finding connections easier than just a note taking application. There were a lot of logistical challenges as well, making sure the survey links were ready, pairing up participants, scheduling time, matching up incentives, booking locations, etc. While we were able to navigate those challenges I learned the importance of planning these logistics far in advance, and ensuring visibility of pivots or decisions.
Attribution: Bullseye by vigorn from NounProject.com, Planning by Larea from NounProject.com, Recruitment by Adrien Coquet from NounProject.com, Find by Dzulfiqar Faiq from NounProject.com, Analysis by Price Jeager from NounProject.com, Report by Alzam from NounProject.com
More Projects


